class: center, middle, inverse, title-slide # Module 4 - Session 2 - Data Visualisation ## Working effectively with data ### CivicDataLab ### 2021/10/21 (updated: 2021-10-21) --- <div> <style type="text/css">.xaringan-extra-logo { width: 110px; height: 128px; z-index: 0; background-image: url(https://drive.google.com/uc?id=1WbdosVvi6SBjYtEF6kHj-f0wotdHMRgw); background-size: contain; background-repeat: no-repeat; position: absolute; top:1em;right:1em; } </style> <script>(function () { let tries = 0 function addLogo () { if (typeof slideshow === 'undefined') { tries += 1 if (tries < 10) { setTimeout(addLogo, 100) } } else { document.querySelectorAll('.remark-slide-content') .forEach(function (slide) { const logo = document.createElement('a') logo.classList = 'xaringan-extra-logo' logo.href = 'https://civicdatalab.in' slide.appendChild(logo) }) } } document.addEventListener('DOMContentLoaded', addLogo) })()</script> </div> # RECAP Topics covered in the last session: 1. The data viz quadrant 2. What restricts us from visualising data 3. Data viz storytelling components **Story | Audience | Medium** 4. Activity - Building a narrative 5. Activity - Reading a data viz 6. Building accessible data visualisations - Check the [Chartability project](https://chartability.fizz.studio/) 7. How to select the most appropriate graph for your data 8. Things to avoid when developing visualisations 9. Information sharing framework when working with external consultants on data viz projects <br/> <br/> ----- .center[ [**Slides**](https://civicdatalab.in/Working-with-Data-Workshops/modules/module_4_data_viz/session-1/session-1.html) | [**Video**](https://youtu.be/qieuVFrFxRo) ] ----- --- # The data viz storytelling process .center[ 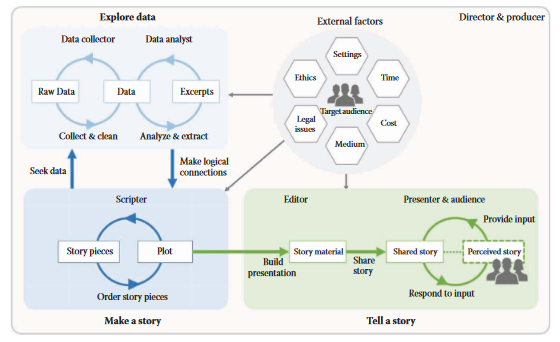 _The storytelling process from the story idea to visually shared stories._<sup>1</sup> ] .footnote[ [1][Data Driven Storytelling](https://medium.com/nightingale/data-driven-%3Cmark%3Estorytelling%3C/mark%3E-a-short-review-93926262a74a) ] --- class: center, middle # Data Viz - The Tooling Landscape --- class: center, middle  --- class: center, middle # Static viz --- # Charticulator .center[**Objective** : Plot month wise cases for all districts of Karnataka from the year 2018] .pull-left[ [](https://charticulator.com/) .center[ Charticulator is a project from Microsoft Research. ] ] .pull-right[  ] ------ .center[ **[Tool](https://charticulator.com/) | [Dataset](https://raw.githubusercontent.com/CivicDataLab/Working-with-Data-Workshops/master/modules/module_4_data_viz/session-2/datasets/KA_2018_monthly_cases_districts.csv)** ] ------ --- # DataWrapper .center[**Objective** : Plot district wise total conviction cases for all districts of Karnataka from the year 2018] .pull-left[ [](https://app.datawrapper.de/) .center[ Datawrapper helps some of the world’s best teams to tell their stories with data. ] ] .pull-right[ [](https://www.datawrapper.de/_/yGrFO/) ] ------ .center[ **[Tool](https://app.datawrapper.de) | [Dataset](https://raw.githubusercontent.com/CivicDataLab/Working-with-Data-Workshops/master/modules/module_4_data_viz/session-2/datasets/KA_2018_district_wise_convictions.csv)** ] ------ --- class: center, middle # Dynamic (or Interactive) viz --- # Flourish .center[ **Objective** : Plot the spread of COVID-19 across states from Jan, 20 - Oct, 21 ] .pull-left[ [](https://flourish.studio/) .center[ Beautiful and easy data visualization and storytelling ] ] .pull-right[ [](https://app.flourish.studio/visualisation/7586483/edit) ] ------ .center[ **[Tool](https://app.flourish.studio/) | [Dataset](https://raw.githubusercontent.com/CivicDataLab/Working-with-Data-Workshops/master/modules/module_4_data_viz/session-2/datasets/covid_data_transposed.csv)** ] ------ --- ## COVID-19 Dynamic Data Viz <iframe src='https://flo.uri.sh/visualisation/7586483/embed' title='Interactive or visual content' class='flourish-embed-iframe' frameborder='0' scrolling='no' style='width:100%;height:600px;' sandbox='allow-same-origin allow-forms allow-scripts allow-downloads allow-popups allow-popups-to-escape-sandbox allow-top-navigation-by-user-activation'></iframe><div style='width:100%!;margin-top:4px!important;text-align:right!important;'><a class='flourish-credit' href='https://public.flourish.studio/visualisation/7586483/?utm_source=embed&utm_campaign=visualisation/7586483' target='_top' style='text-decoration:none!important'><img alt='Made with Flourish' src='https://public.flourish.studio/resources/made_with_flourish.svg' style='width:105px!important;height:16px!important;border:none!important;margin:0!important;'> </a></div> --- class: center, middle # Maps --- ## Maps - StoryMap - KnightLab .pull-left[ [](https://storymap.knightlab.com/) .center[ StoryMapJS is a free tool to help you tell stories on the web that highlight the locations of a series of events. ] ] .pull-right[ [](https://storymap.knightlab.com/edit/?id=optimal-road-trip) ] ------ .center[ **[Tool](https://storymap.knightlab.com/) | [Dataset](https://behindbars.netlify.app/docs/optimal-trip/)** ] ------ --- ## Maps - Designing a Road Trip around India <iframe src='https://uploads.knightlab.com/storymapjs/f287bd3a137f982d797c44bf54fb3e9b/optimal-road-trip/index.html' title='Interactive or visual content' class='flourish-embed-iframe' frameborder='0' scrolling='no' style='width:100%;height:600px;' sandbox='allow-same-origin allow-forms allow-scripts allow-downloads allow-popups allow-popups-to-escape-sandbox allow-top-navigation-by-user-activation'></iframe> --- ## Maps - Static .pull-left[ [](https://www.datawrapper.de/maps) .center[ More than static maps: responsive, customizable and live-updating. **[Tool](https://www.datawrapper.de/maps) | [Dataset](https://raw.githubusercontent.com/CivicDataLab/Working-with-Data-Workshops/master/modules/module_4_data_viz/session-2/datasets/covid_state_wise_cumulative.csv)** ] ] .pull-right[ [](https://datawrapper.dwcdn.net/VJAyt/1/) ] --- <iframe title="Confirmed COVID cases as on 07/10/21" aria-label="Map" id="datawrapper-chart-VJAyt" src="https://datawrapper.dwcdn.net/VJAyt/1/" scrolling="no" frameborder="0" style="width: 0; min-width: 100% !important; border: none;" height="775"></iframe><script type="text/javascript">!function(){"use strict";window.addEventListener("message",(function(e){if(void 0!==e.data["datawrapper-height"]){var t=document.querySelectorAll("iframe");for(var a in e.data["datawrapper-height"])for(var r=0;r<t.length;r++){if(t[r].contentWindow===e.source)t[r].style.height=e.data["datawrapper-height"][a]+"px"}}}))}(); </script> --- class: center, middle # Tables --- # Table - Datawrapper .center[ **Objective** : Display the total number of registered calls of women users across states from 2016-17 till 2019-20 ] .pull-left[ [](https://app.datawrapper.de/) .center[ Create responsive tables with Datawrapper ] ] .pull-right[ [](https://datawrapper.dwcdn.net/a06XO/2/) ] ------ .center[ **[Tool](https://www.datawrapper.de/tables) | [Dataset](https://raw.githubusercontent.com/CivicDataLab/Working-with-Data-Workshops/master/modules/module_4_data_viz/session-2/datasets/wcd_whl_data.csv)** ] ------ --- ## Table - Women help line scheme <iframe title="Women Help Line Scheme" aria-label="table" id="datawrapper-chart-a06XO" src="https://datawrapper.dwcdn.net/a06XO/2/" scrolling="no" frameborder="0" style="width: 0; min-width: 100% !important; border: none;" height="896"></iframe><script type="text/javascript">!function(){"use strict";window.addEventListener("message",(function(e){if(void 0!==e.data["datawrapper-height"]){var t=document.querySelectorAll("iframe");for(var a in e.data["datawrapper-height"])for(var r=0;r<t.length;r++){if(t[r].contentWindow===e.source)t[r].style.height=e.data["datawrapper-height"][a]+"px"}}}))}(); </script> --- class: center, middle # Timeline --- # Timeline - KnightLab .pull-left[ [](https://timeline.knightlab.com/) .center[ TimelineJS is an open-source tool that enables anyone to build visually rich, interactive timelines. ] ] .pull-right[ [](https://cdn.knightlab.com/libs/timeline3/latest/embed/index.html?source=1xuY4upIooEeszZ_lCmeNx24eSFWe0rHe9ZdqH2xqVNk&font=Default&lang=en&initial_zoom=2&height=100%) ] ------ .center[ **[Tool](https://timeline.knightlab.com/#examples)** ] ------ --- ## Timeline demo - Women in Computing <iframe src='https://cdn.knightlab.com/libs/timeline3/latest/embed/index.html?source=1xuY4upIooEeszZ_lCmeNx24eSFWe0rHe9ZdqH2xqVNk&font=Default&lang=en&height=70%' title='Interactive or visual content' class='flourish-embed-iframe' frameborder='0' scrolling='no' style='width:100%;height:600px;' sandbox='allow-same-origin allow-forms allow-scripts allow-downloads allow-popups allow-popups-to-escape-sandbox allow-top-navigation-by-user-activation'></iframe> --- # Resources - To select a chart .pull-left[  ] .pull-right[ [](https://raw.githubusercontent.com/Financial-Times/chart-doctor/main/visual-vocabulary/poster.png) 1. [From Data to Viz](https://www.data-to-viz.com/) 2. [FT - Visual Vocabulary](https://raw.githubusercontent.com/Financial-Times/chart-doctor/main/visual-vocabulary/poster.png) 3. [Information design for the human brain](http://paldhous.github.io/NICAR/2016/infodesign.html) ] --- # Other Resources .pull-left[ ### Creating accessible data viz - The [Chartability project](https://chartability.fizz.studio/) - [Accessibility Features Demo - HighCharts](https://www.highcharts.com/accessibility/) ### Tools - [Visualisation Tools](https://gijn.org/visualization-tools/) - [RAWGraphs](https://rawgraphs.io) - [DataWrapper](https://www.datawrapper.de) - [For creating infographics - Infogram](https://infogram.com/) - [Dashboard - Metabase](https://www.metabase.com/) - [Dashboard - Superset](https://superset.apache.org/) ] .pull-right[ ### Links 1. [Creating responsive data visualisations](https://www.gurmanbhatia.com/talk/2020/11/28/responsive-data-viz-phone.html) 2. [Visualizing How India Reacted to Decriminalization of Homosexuality](https://towardsdatascience.com/the-13-x-29-project-visualizing-how-india-reacted-to-decriminalization-of-homosexuality-8d105f828748) 3. [India in Pixels](https://www.instagram.com/india.in.pixels/) 4. [Demo of how data can tell any story you want, ode to Tokyo](https://junkcharts.typepad.com/numbersruleyourworld/2021/08/demo-of-how-data-can-tell-any-story-you-want-ode-to-tokyo.html) 5. [Data Viz - Style Guides](https://policyviz.com/2016/11/30/style-guides/) 6. [PolicyViz](https://policyviz.com/blog/) 7. [How to Use Storytelling Conventions to Create Better Visualizations](https://medium.com/nightingale/how-to-use-storytelling-conventions-to-create-better-visualizations-45177ae517ba) ] --- class: center, middle # Queries and Feedback